Bitcoin Traders on Alert as Rally Nears Make-or-Break Zone
What to Know
- $73,750 to $74,400 — Bitcoin is approaching a historic two-year make-or-break price zone that has defined major trend reversals
- 10% — BTC rallied sharply this week to trade above $72,000, briefly touching $73,900 on Wednesday
- $700 million in U.S. spot Bitcoin ETF inflows since the start of March has fueled the current bounce
- A decisive break above the zone would signal renewed bullish momentum, while rejection confirms the broader downtrend from October remains intact
Bitcoin is charging toward a pivotal make-or-break price zone that has shaped market direction for two years, demanding heightened vigilance from traders. The leading cryptocurrency surged 10% this week to trade above $72,000, momentarily spiking past $73,900 on Wednesday, according to market data. Powered by robust ETF inflows, the rally now faces its most consequential test at the $73,750 to $74,400 range — a level that has historically marked the exhaustion of both bull runs and bear slides.
Why Does the $73,750-$74,400 Zone Matter?
The $73,750 to $74,400 Bitcoin price zone has served as a decisive inflection point across multiple market cycles. In the first quarter of 2024, the ETF-driven uptrend that launched with spot products debuting in the U.S. stalled at $73,750 as buyer exhaustion set in. Prices subsequently retreated, sliding to roughly $50,000 in the months that followed.
In early April 2025, the same range played an equally critical but opposite role. The downtrend that originated above $100,000 in February saw selling finally dry up near $74,400. Bitcoin reversed course and climbed steadily, reaching fresh all-time highs above $126,000 by October. This dual function — capping rallies and arresting declines — makes the zone pivotal for current price action.
ETF Inflows Fuel the Recovery
Renewed institutional demand through exchange-traded funds has underpinned the current rally. Approximately $700 million has flowed into U.S. spot Bitcoin ETF inflows since the beginning of March 2026, providing meaningful buying pressure. This capital injection, combined with easing geopolitical tensions, has propelled the 10% weekly gain and reignited bullish sentiment across the broader crypto market.
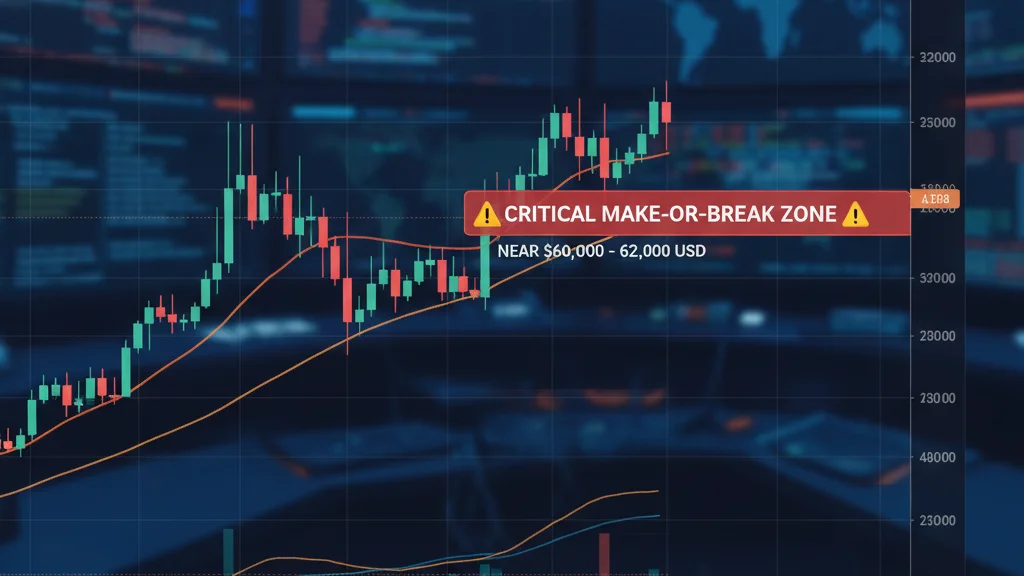
Earlier this year, the $73,750-$74,400 range was widely referenced as strong support — an area where institutional buyers were expected to defend. However, prices breached this floor early last month, triggering a deeper slide to nearly $60,000. Bitcoin's recovery to retest this same area from below adds another layer of technical significance to the current setup.
What Happens if Bitcoin Breaks Through?
A clean breakout above $74,400 would represent a profoundly bullish development, indicating sufficient buying pressure to overcome a resistance level that has defined market structure for two years. Such a move would suggest the broader downtrend from October has been invalidated, opening the path toward a fresh leg higher.
Conversely, a failure to breach the zone would likely confirm that the multi-month decline from October's highs above $126,000 remains firmly in control. In that scenario, traders should brace for continued downside pressure, with the $60,000 region serving as the next major area of interest. The coming days will be critical in determining which path prevails, making close monitoring of price action around the $73,750-$74,400 band essential for market participants.
Stay ahead of the market.
Crypto news and analysis delivered every morning. Free.
More from Bitcoinomist
About the Author
Senior Crypto Journalist
Kevin Giorgin is a senior crypto journalist with over five years of experience covering Bitcoin, DeFi, and blockchain technology at Bitcoinomist.
View all contributorsFollow bitcoinomist.io on Google News to receive the latest news about blockchain, crypto, and web3.
Follow us on Google News