Bitcoin Drops Under $71K, ETH, DOGE Dip as War Rally Stalls
What to Know
- $70,987 — Bitcoin retreated from Thursday's $74,000 peak, falling 2.2% in 24 hours as the war-week rally hit technical resistance
- 61.8% Fibonacci retracement and the 50-day moving average converged near $74,000, creating a technically crowded rejection zone
- 3.7% weekly decline for Dogecoin made it the worst performer among major cryptocurrencies
- $70,000 now serves as the first key support level, with a break lower putting the $64,000 floor back in play
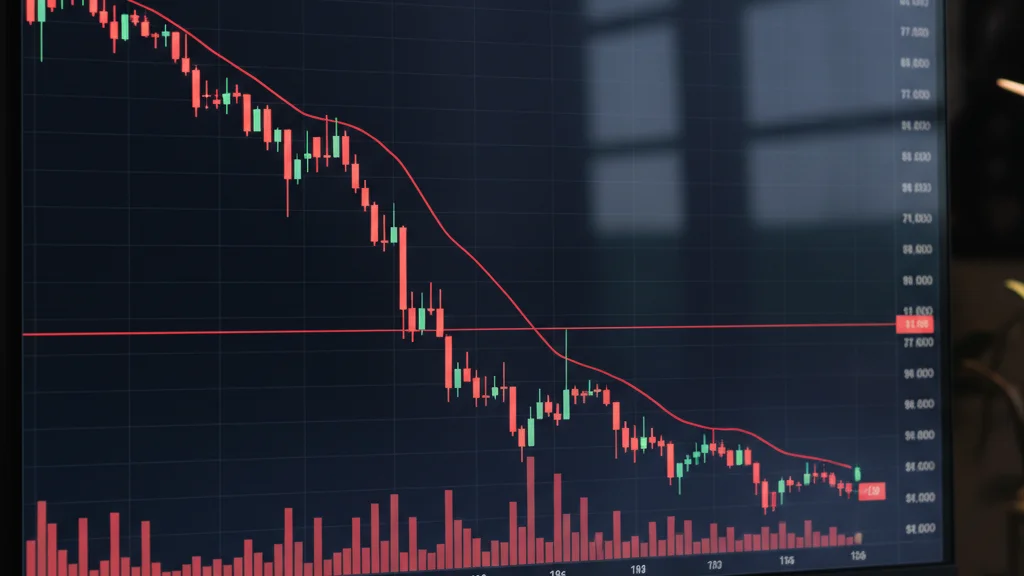
Bitcoin dropped below $71,000 on March 6, 2026, surrendering a significant chunk of its war-week gains after Thursday's surge to $74,000 collided with heavy technical resistance. The largest cryptocurrency by market capitalization slipped to $70,987 during mid-day trading in East Asia, shedding 2.2% over the prior 24 hours as both altcoins and risk assets came under renewed selling pressure.
Why Did Bitcoin's Rally Stall at $74,000?
The five-day advance from Saturday's conflict-driven trough near $64,000 to Thursday's $74,000 high represented a roughly 15% gain, but the pullback has since erased approximately one-third of that move. FxPro chief analyst Alex Kuptsikevich pointed out that the rejection aligned with the 61.8% Fibonacci retracement level and fell just short of the 50-day moving average — two technical barriers that historically attract sellers during Bitcoin bear market rallies.
Fibonacci retracement levels stem from a mathematical sequence that traders deploy to pinpoint where a bounce is likely to exhaust itself. After a steep decline, prices tend to recover a predictable percentage of the drop before the prevailing trend reasserts itself. The 61.8% mark is the most closely monitored because it indicates a recovery has clawed back roughly two-thirds of its losses — enough to appear convincing, yet historically the zone where relief rallies tend to falter.
The 50-day moving average functions as a dynamic resistance line during downtrends, representing the price at which the average recent buyer breaks even and may choose to exit rather than hold. Bitcoin encountering both levels simultaneously turned $74,000 into a technically crowded ceiling.
The bulls still have to convince the community that the bear market is over.
— Alex Kuptsikevich, FxPro Chief Analyst
Short Squeeze Dynamics and Liquidation Clusters
Kuptsikevich added that the magnitude of the rally was driven largely by a short squeeze, noting that bears had placed their stops too close to the market price. Bitunix analysts offered a complementary read on the microstructure, flagging that the push to $74,000 triggered concentrated short liquidations. Meanwhile, long leverage liquidation clusters sit around $70,000, with secondary liquidity pools near Dogecoin's reference level of $64,000.
That arrangement creates a well-defined trading range, with both the floor and ceiling clearly visible on the liquidation heat map. A decisive break in either direction would likely trigger cascading liquidations that accelerate the move.
Weekly Crypto Scoreboard
Despite the pullback, the seven-day numbers still favor the majors. Bitcoin is up 5.4% on the week. Ether gained 2.7% to trade at $2,080, while BNB climbed 3.1% to $648. Solana advanced 2.1% to $88.39. The notable laggards were Dogecoin, which shed 3.7% over the period, and XRP, essentially unchanged with a modest 0.2% decline.
Macro Headwinds From the Iran Conflict
The broader macroeconomic picture heading into the weekend remains turbulent. Asia's benchmark equity index has tumbled 6.4% since the Iran war erupted, putting MSCI's regional gauge on course for its worst weekly showing since March 2020. The U.S. dollar is tracking toward its strongest week since November 2024, and oil is posting its biggest weekly surge since 2022 — conditions that rarely sustain a crypto rally.
Friday offered a glimmer of tentative relief as Asian equities pared early losses after the dollar softened and crude prices eased on reports that the U.S. was weighing options to address the energy cost spike. Yet the conflict remains unresolved. The Senate failed to block President Trump's continued military operations against Iran, leaving war costs and energy disruption as open variables. Defense Secretary Hegseth has indicated operations could stretch three to eight weeks, and the Strait of Hormuz remains effectively disrupted.
What This Means Going Forward
The $70,000 threshold that served as resistance for a month has now become the first meaningful test of support. Holding above that level would lend credibility to the notion that the breakout from the war-driven low is genuine. Losing it, however, puts the $64,000 floor back into focus — the same level where buyers stepped in last Saturday when the conflict initially rattled markets. Traders will be watching the liquidation heat map closely over the weekend for signs of which side blinks first.
Stay ahead of the market.
Crypto news and analysis delivered every morning. Free.
More from Bitcoinomist
About the Author
Senior Crypto Journalist
Kevin Giorgin is a senior crypto journalist with over five years of experience covering Bitcoin, DeFi, and blockchain technology at Bitcoinomist.
View all contributorsFollow bitcoinomist.io on Google News to receive the latest news about blockchain, crypto, and web3.
Follow us on Google News