3 Solana Data Points Show Resilience, Is SOL Undervalued?
What to Know
- $108 billion in 30-day DEX volume positions Solana well ahead of Ethereum and Base despite SOL trading 72% below its all-time high
- Spot SOL ETFs saw only $11.3 million in cumulative outflows over two weeks, far less than the four straight months of negative flows in BTC and ETH ETFs
- Solana's RWA sector climbed to an all-time high of $1.71 billion, up 45% in 30 days
- Key technical levels to watch include the $51-$80 demand zone and $120 weekly resistance that will shape SOL's next major move
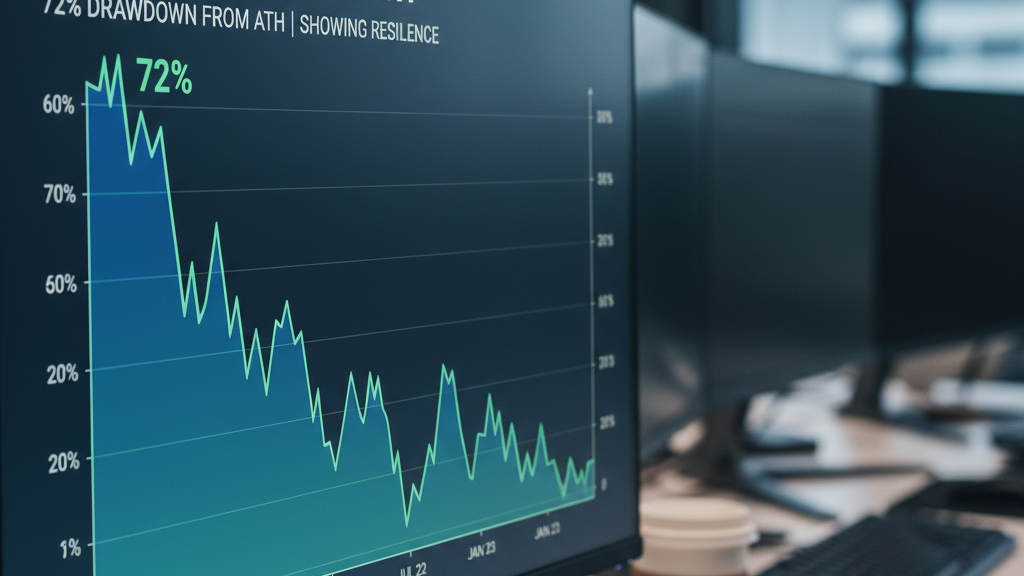
Solana continues to demonstrate robust onchain fundamentals even as SOL trades at roughly $86, down 72% from its record peak of $295 and far below the $188 price seen when spot exchange-traded funds launched in October 2025. Three critical data points spanning ETF flows, decentralized exchange activity, and network revenue suggest the token may be deeply discounted relative to its underlying usage, raising the question of whether SOL is genuinely undervalued or simply caught in a broader market downturn.
SOL ETF Flows Outperform Bitcoin and Ether
Spot Solana ETFs have held up remarkably well compared to their Bitcoin and Ether counterparts during the recent drawdown. When the products debuted in late October 2025, they attracted over $100 million in average weekly net inflows across their first five weeks of trading. Weekly capital entering the funds has since cooled to between $20 million and $25 million as SOL's price slid over the following four months.
Importantly, cumulative outflows across the entire pullback totaled just $11.3 million over a two-week stretch, according to fund flow data. Spot Bitcoin and spot Ether ETFs, by contrast, logged four consecutive months of negative flows during the same window. That divergence indicates institutional holders have largely maintained their Solana positions rather than unwinding exposure, a signal that capital conviction around the network remains intact even amid significant price weakness.
Is SOL Undervalued Based on Network Activity?
Solana's onchain metrics strongly suggest the network is outperforming its price action. Over the past 30 days, Solana processed $108 billion in decentralized exchange volume, dwarfing Ethereum's $63.7 billion and Base's $31.48 billion, according to DEX aggregator data. January volumes reached $117 billion, topping both December and November totals, with weekly averages hovering near $20 billion to $25 billion since the start of 2025.
In the most recent 24-hour period, Solana generated $3.1 million in application revenue versus Ethereum's $2.95 million. Active addresses stood at 2.17 million compared to Ethereum's 682,236, while chain fees reached $722,706 against $356,438 on Ethereum. The Solana real-world asset sector also reached a fresh all-time high of $1.71 billion, climbing 45% in 30 days, though Ethereum still dominates the broader RWA space with $15 billion of the industry's $25.37 billion in distributed asset value.
Technical Outlook: Key Levels to Monitor
Where Could SOL Find a Bottom?
Crypto trader Scient identified two macro zones that could define a potential floor for SOL. The first sits at the 0.75 Fibonacci retracement area between $60 and $70, a level typically associated with deeper corrections within broader uptrends. The second is a weekly demand fair value gap between $22 and $29, a zone of prior liquidity imbalance that preceded the explosive rally from $25 to $200.
On the weekly chart, SOL has already tested the demand zone between $51 and $80, which aligns with that Fibonacci retracement pocket and could serve as a launchpad for recovery from current levels. However, the structure remains capped with price holding below weekly resistance at $120, a level that bulls must reclaim to shift the broader trend.
The 0.75 Fibonacci retracement zone between $60 and $70 and the weekly demand fair value gap between $22 and $29 are the two macro areas that may shape a potential bottom.
— Scient, Crypto Trader
Supply Distribution Adds Valuation Context
UTXO Realized Price Distribution data provides additional perspective on SOL's current positioning. Over 6% of the total supply last changed hands within the present price cluster, establishing a dense cost basis zone around current levels. The next meaningful concentration, representing more than 3% of supply, sits between $20 and $30, far below the current trading range.
From a valuation standpoint, SOL is anchored near a heavily populated realized supply cluster while ETF positioning has not meaningfully unwound and DEX turnover leads all competing chains despite Solana's comparatively lower total value locked. The compression in price alongside persistent capital inflows and expanding network utilization reveals a measurable disconnect between activity and market valuation. Whether that gap closes through upward SOL price action will ultimately depend on how the $51 to $80 support band and the $120 resistance ceiling interact with these fundamental factors over the coming months.
Stay ahead of the market.
Crypto news and analysis delivered every morning. Free.
More from Bitcoinomist
About the Author
Senior Analyst
Kevin Giorgin is an award-winning crypto journalist with over five years of experience covering Bitcoin, DeFi, and blockchain technology at Bitcoinomist.
View all contributorsFollow bitcoinomist.io on Google News to receive the latest news about blockchain, crypto, and web3.
Follow us on Google News